


Making Infographics Memorable
Posted on Feb 3, 2014 in Design/Publishing/Trends
While infographics are not a new way of expressing information and data, it seems that their popularity is rising among associations who previously published information in written form. We are certainly seeing this among our clients and encouraging them to do infographics in a thoughtful, memorable and meaningful way.
Associations Now shared a great article titled, “Tell Your Story Visually with an Infographic,” on the use of infographics. Quoted in the article, Nicole Lampe, digital strategy director at Resource Media on NTEN: The Nonprofit Technology Network’s blog, says a meaningful infographic answers the questions who, what, why, and how. In addition, she says that it can be “social media solid gold,” especially if you can pinpoint what compels your audience to share, like or tweet.
Both articles above are terrific resources for identifying your audience, creating the right data, a spot-on graphic and a solid way to reach them. I’m definitely taking notes!
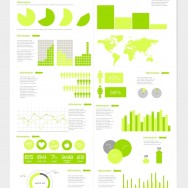
Need a little inspiration? How about some graphic elements to get you started thinking? As I was looking for my own inspiration recently on Pinterest (where else?), I found a great FREE infographic template sure to get you thinking about ways to illustrate your latest annual report, media kit analytics or publication readership statistics. Enjoy!
— Andrea Exter, Cofounder, Monarch Media & Consulting, Inc.
